Is your website down? A layer-by-layer troubleshooting guide for site owners
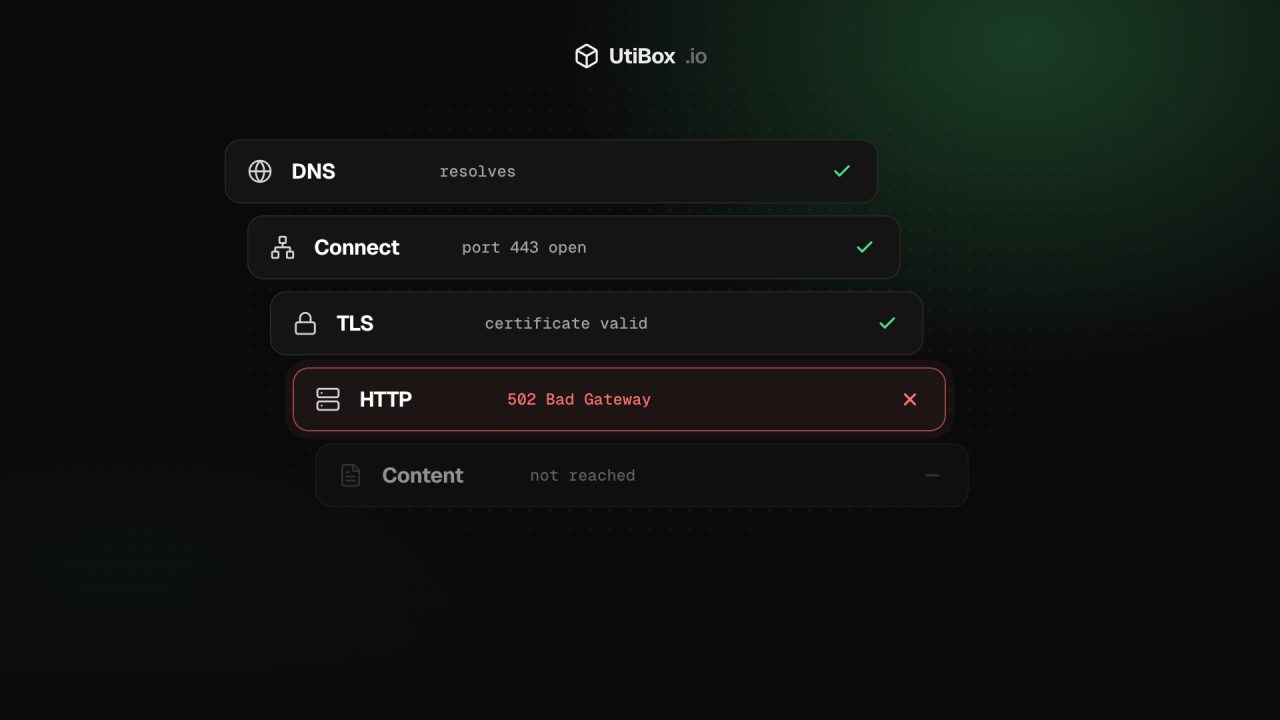
When your site stops loading, work through it in the same order a browser does: DNS, connection, certificate, HTTP response and content. This guide shows how to find the broken layer in minutes, what each error code means and what to check on the server.
Illustration: UtiBox
Your phone buzzes: “the site’s down”. The fastest way to fix it is to stop guessing and check the layers in the order a browser goes through them. The first layer that fails is almost always where the problem is.
Step 0: Is it down for everyone?
Before you touch anything, check from somewhere other than your own network. The Website Down Checker opens your site from our server and shows each step of the request. If it loads fine from there, the problem is more likely your connection, your network or your device. Run the Connection Test to check your own line.
If our server can’t reach it either, carry on through the layers below.
Layer 1: DNS (does the name still point to your server?)
Every visit starts by turning your domain name into an IP address. Problems here look like “server not found” or DNS_PROBE_FINISHED_NXDOMAIN.
- Use DNS Lookup to see the A, AAAA and CNAME records. Do they point at your current server or load balancer?
- Changed DNS recently? Use the DNS Propagation Checker to see whether six large public resolvers have the new answer yet.
- Check the domain hasn’t expired with WHOIS Lookup. An expired domain is a surprisingly common cause of “everything is down”.
Layer 2: Connection (is the server answering at all?)
If DNS is right but nothing connects, the server is off, overloaded, or a firewall is blocking it.
- The Ping Test measures how long a TCP connection to your web port takes, five times in a row. Failures or wildly varying times point at the server or the network in front of it.
- Many servers block ICMP, so a classic
pingfailing doesn’t prove much on its own. A failed connection to port 443 does.
Layer 3: TLS (is the certificate valid?)
A broken certificate shows visitors a full-page warning such as NET::ERR_CERT_DATE_INVALID instead of your site. Run the SSL Certificate Checker and look at the days left, the names covered and the chain. Our certificate guide covers the five usual causes.
Layer 4: HTTP (what is the server saying?)
If the connection and certificate are fine, the HTTP Status Checker shows the exact status code and headers your site returns. The code tells you where to look:
| Code | What it usually means | Where to look |
|---|---|---|
| 500 | The application crashed | Application and PHP or framework error logs |
| 502 | The web server couldn’t get an answer from the app behind it | Is PHP-FPM, Node or your app server running? |
| 503 | Overloaded, or in maintenance mode | Resource usage, maintenance flags, rate limits |
| 504 | The app took too long to answer | Slow database queries, external APIs, timeouts |
| 403 | Access refused | File permissions, .htaccess, firewall or WAF rules |
| 404 | The page isn’t there | Deploy path, rewrites, recently moved pages |
Site stuck in a loop, or ending up somewhere odd? The Redirect Checker lists every hop. Redirect loops between http and https, or between www and the bare domain, are common after changing CDN or SSL settings.
Layer 5: Content (it loads, but something is wrong)
Sometimes the server says 200 OK but the page is blank, half-styled or very slow. The Response Time Test shows how long the page takes, and the Website Health Report checks every layer at once, including the page title and six security headers, which makes it a quick before-and-after comparison.
On the server: the usual suspects
Once you know which layer failed, these commands find most causes on a Linux server:
# Is the web server running?
sudo systemctl status nginx        # or apache2 / httpd
sudo systemctl status php8.4-fpm   # name varies with your PHP version

# What do the logs say?
sudo tail -n 50 /var/log/nginx/error.log
sudo journalctl -u php8.4-fpm --since "30 min ago"

# Out of disk or memory?
df -h
free -m

# Is anything listening on 80 and 443?
sudo ss -tlnp | grep -E ':80|:443'
A full disk quietly breaks databases, sessions and logs, and it’s behind a surprising number of 500 and 502 errors. Clearing old logs and backups often brings a site straight back.
While you fix it
- Tell people. A short post on your status page or social accounts saves you dozens of messages.
- Change one thing at a time, and write down what you changed, so you can undo it.
- Afterwards, note what failed, how you found it and what would have warned you sooner. That’s the start of proper monitoring.
Checking a big service instead?
If it’s not your site but a service you rely on (GitHub, Cloudflare, Steam, ChatGPT), check its UtiBox status page. It combines our own measurements, checks from other regions, what other visitors are reporting and the provider’s official status.
Related


More from Guides

XML sitemaps search engines can read: limits and common errors
One unescaped character can stop a crawler reading the rest of your sitemap. Here’s what belongs in an XML sitemap, the limits set by sitemaps.org and Google, the errors that break it, and how to…

Heading structure: one H1, no skipped levels, and why it matters
Headings are how readers skim a page and how assistive technology moves around it. Here’s what the HTML standard and WCAG ask for, what Google actually says about headings, and how to check any…

How to write titles and meta descriptions that fit Google’s search results
Google cuts titles and snippets to fit the screen, and sometimes writes its own. Here’s what Google’s documentation actually says, and how to draft, count and check yours before and after a page…


